
Solve a medical mystery with a confusion matrix 🧪
Throughout your life (and especially in the era of COVID! 🦠), you’ve probably taken a bunch of diagnostic tests to detect the presence or absence of a condition.
Have you ever wondered how much you should trust the test result? Since you’re reading a Data Science blog, I’m going to guess the answer is “yes”!
Below, I’m going to pose a made-up testing scenario, and together we’ll figure out how to use a confusion matrix to solve this mystery!
Here’s the scenario:
Let’s pretend that there's a disease that is present in 2% of the population. (That's known as the "prevalence" of the disease.)
The disease can be detected by a nasal swab, and the test is 95% accurate for both positive and negative cases. (More formally, the test’s "True Positive Rate" and "True Negative Rate" are both 95%.)
You were tested for the disease and received a positive test result. What is the probability that you actually have the disease?
Why use a confusion matrix?
There are many methods you could use to solve this problem, but I’m going to create a confusion matrix since it helps me to visualize the problem.
If you’re not familiar with the confusion matrix, it’s a table that describes the performance of a classifier on a set of test data for which the true values are known.
In this case, the nasal swab is the classifier, and we will fill in the test data for which the true values are known based on the True Positive and True Negative Rates stated above.
(Side note: These rates would have been determined by the company that developed the nasal swab based on clinical trials they conducted prior to releasing the test.)
Step 1:
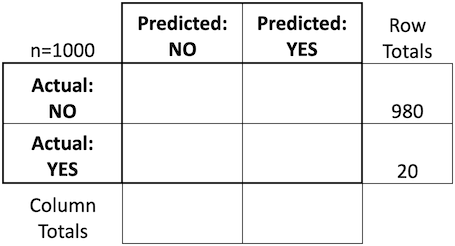
Let’s pretend there are 1000 people in the population. Because the stated prevalence of the disease is 2%, we believe that the disease is present in 2% of those 1000 people, or 20 people.
We can now begin to fill in the confusion matrix. There are two rows, “Actual YES” and “Actual NO”, meaning how many people actually have the disease:
- The Actual YES row contains a total of 20 people.
- The Actual NO row contains the remaining 980 people.
Step 2:
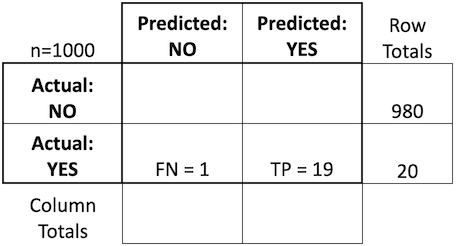
As stated above, when someone actually has the disease, the nasal swab will return a positive result 95% of the time.
In other words, it will predict YES for 95% of those people (which is the correct result), and it will predict NO for 5% of those people (which is the incorrect result).
- The Actual YES / Predicted YES box contains 19 people, since 0.95 x 20 = 19. These are called True Positives (TP).
- The Actual YES / Predicted NO box contains 1 person, since 0.05 x 20 = 1. These are called False Negatives (FN).
Step 3:
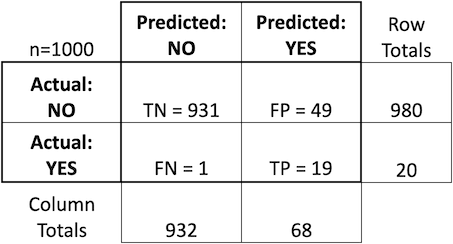
As stated above, when someone does not actually have the disease, the nasal swab will return a negative result 95% of the time.
In other words, it will predict NO for 95% of those people (which is the correct result), and it will predict YES for 5% of those people (which is the incorrect result).
- The Actual NO / Predicted NO box contains 931 people, since 0.95 x 980 = 931. These are called True Negatives (TN).
- The Actual NO / Predicted YES box contains 49 people, since 0.05 x 980 = 49. These are called False Positives (FP).
Now that we have filled in the confusion matrix, we can also calculate the column totals for Predicted NO (931 + 1 = 932) and Predicted YES (49 + 19 = 68).
Calculate the answer:
Finally, we’re ready to answer the question!
Given that you received a positive result from the nasal swab, what is the probability that you actually have the disease?
In our population of 1000 people, 68 tested positive (indicated by the Predicted YES column total). You represent one of those 68 people.
Of those 68 people, 19 actually have the disease (True Positives) and 49 do not (False Positives).
Thus if you test positive, the probability that you actually have the disease is 19 / 68 = 27.9%.
Wait, what???
27.9% might “feel” like the wrong answer, given that the test is 95% accurate. But here’s the key insight:
For a condition with low prevalence, most of the positive test results will be False Positives (even for a highly accurate test), since there are far more people taking the test who don’t have the condition than do have the condition.
Here’s my challenge to you:
One way to reduce the number of False Positives is to only test people who are symptomatic for the condition, since that significantly increases the prevalence within the population being tested.
To see an example of this, change the prevalence in the scenario above from 2% to 30% and then recreate the confusion matrix. In this new scenario, what is the probability that you actually have the disease, given that you tested positive?
Post your answer in the comments section below and I’ll let you know if you’re correct! ✅
Learn more:
The confusion matrix is widely used in Machine Learning and many other fields. If you’re interested in learning more, I highly recommend reading my blog post: Simple guide to confusion matrix terminology.
I also created a 35-minute video that goes deeper into this topic: Making sense of the confusion matrix.
Finally, the Wikipedia page is also quite good: Wikipedia: Confusion matrix.
Keep in mind that confusion matrices are not always formatted the same way! For example, the Wikipedia page places the YES values instead of the NO values in the upper left, so it’s important to pay attention to the labels when interpreting a confusion matrix! 💡