
Simple guide to confusion matrix terminology
A confusion matrix is a table that is often used to describe the performance of a classification model (or "classifier") on a set of test data for which the true values are known. The confusion matrix itself is relatively simple to understand, but the related terminology can be confusing.
I wanted to create a "quick reference guide" for confusion matrix terminology because I couldn't find an existing resource that suited my requirements: compact in presentation, using numbers instead of arbitrary variables, and explained both in terms of formulas and sentences.
Let's start with an example confusion matrix for a binary classifier (though it can easily be extended to the case of more than two classes):
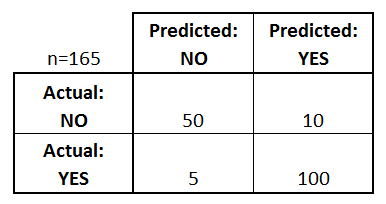
What can we learn from this matrix?
- There are two possible predicted classes: "yes" and "no". If we were predicting the presence of a disease, for example, "yes" would mean they have the disease, and "no" would mean they don't have the disease.
- The classifier made a total of 165 predictions (e.g., 165 patients were being tested for the presence of that disease).
- Out of those 165 cases, the classifier predicted "yes" 110 times, and "no" 55 times.
- In reality, 105 patients in the sample have the disease, and 60 patients do not.
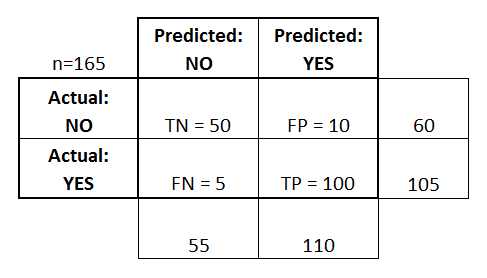
Let's now define the most basic terms, which are whole numbers (not rates):
- true positives (TP): These are cases in which we predicted yes (they have the disease), and they do have the disease.
- true negatives (TN): We predicted no, and they don't have the disease.
- false positives (FP): We predicted yes, but they don't actually have the disease. (Also known as a "Type I error.")
- false negatives (FN): We predicted no, but they actually do have the disease. (Also known as a "Type II error.")
I've added these terms to the confusion matrix, and also added the row and column totals:
This is a list of rates that are often computed from a confusion matrix for a binary classifier:
- Accuracy: Overall, how often is the classifier correct?
- (TP+TN)/total = (100+50)/165 = 0.91
- Misclassification Rate: Overall, how often is it wrong?
- (FP+FN)/total = (10+5)/165 = 0.09
- equivalent to 1 minus Accuracy
- also known as "Error Rate"
- True Positive Rate: When it's actually yes, how often does it predict yes?
- TP/actual yes = 100/105 = 0.95
- also known as "Sensitivity" or "Recall"
- False Positive Rate: When it's actually no, how often does it predict yes?
- FP/actual no = 10/60 = 0.17
- True Negative Rate: When it's actually no, how often does it predict no?
- TN/actual no = 50/60 = 0.83
- equivalent to 1 minus False Positive Rate
- also known as "Specificity"
- Precision: When it predicts yes, how often is it correct?
- TP/predicted yes = 100/110 = 0.91
- Prevalence: How often does the yes condition actually occur in our sample?
- actual yes/total = 105/165 = 0.64
A couple other terms are also worth mentioning:
- Null Error Rate: This is how often you would be wrong if you always predicted the majority class. (In our example, the null error rate would be 60/165=0.36 because if you always predicted yes, you would only be wrong for the 60 "no" cases.) This can be a useful baseline metric to compare your classifier against. However, the best classifier for a particular application will sometimes have a higher error rate than the null error rate, as demonstrated by the Accuracy Paradox.
- Cohen's Kappa: This is essentially a measure of how well the classifier performed as compared to how well it would have performed simply by chance. In other words, a model will have a high Kappa score if there is a big difference between the accuracy and the null error rate. (More details about Cohen's Kappa.)
- F Score: This is a weighted average of the true positive rate (recall) and precision. (More details about the F Score.)
- ROC Curve: This is a commonly used graph that summarizes the performance of a classifier over all possible thresholds. It is generated by plotting the True Positive Rate (y-axis) against the False Positive Rate (x-axis) as you vary the threshold for assigning observations to a given class. (More details about ROC Curves.)
And finally, for those of you from the world of Bayesian statistics, here's a quick summary of these terms from Applied Predictive Modeling:
In relation to Bayesian statistics, the sensitivity and specificity are the conditional probabilities, the prevalence is the prior, and the positive/negative predicted values are the posterior probabilities.
Want to learn more?
In my new 35-minute video, Making sense of the confusion matrix, I explain these concepts in more depth and cover more advanced topics:
- How to calculate precision and recall for multi-class problems
- How to analyze a 10-class confusion matrix
- How to choose the right evaluation metric for your problem
- Why accuracy is often a misleading metric
Let me know if you have any questions!