
How to calculate "scoring streaks" with pandas 🏀
March Madness, the famous US college basketball tournament, starts tomorrow! 🎉
One term that you'll hear a lot during games is "scoring streaks" or "scoring runs". For example, a team that's on a 12-point scoring run has scored 12 points in a row without the other team scoring any points.
So I was wondering: How can we calculate scoring runs using pandas? 🐼
Let's find out! 👇
Example scoring data
Let's pretend this was our scoring data. There's one row for each time a team scored points:
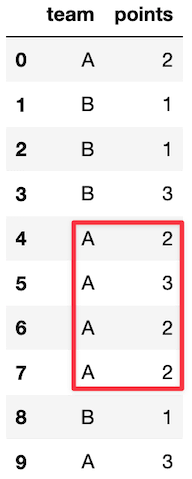
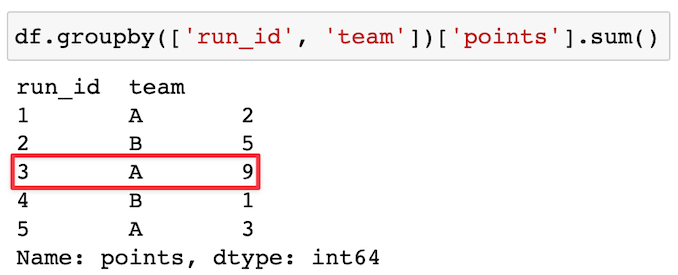
In this case, the largest scoring run was when A scored 9 points in a row.
Identify each scoring run
Now we need to figure out when each scoring run starts!
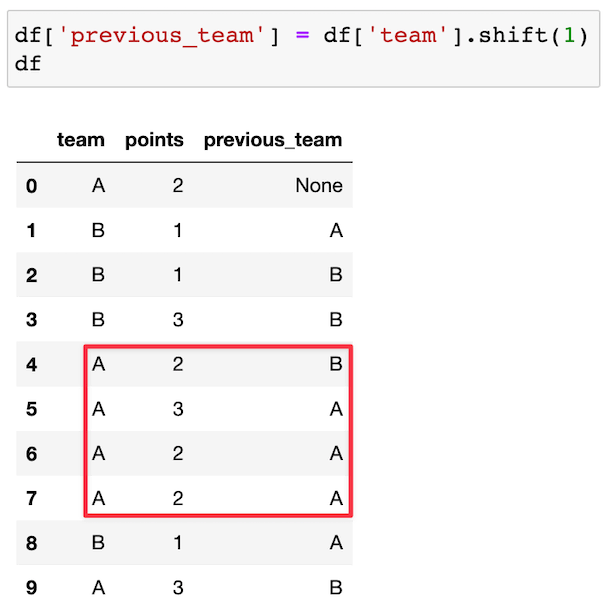
First, we use the shift() method to shift all of the teams down a row, and store those in a column called previous_team:
Then, we check if team is not equal to previous_team, and store the boolean result in a column called start_of_run:
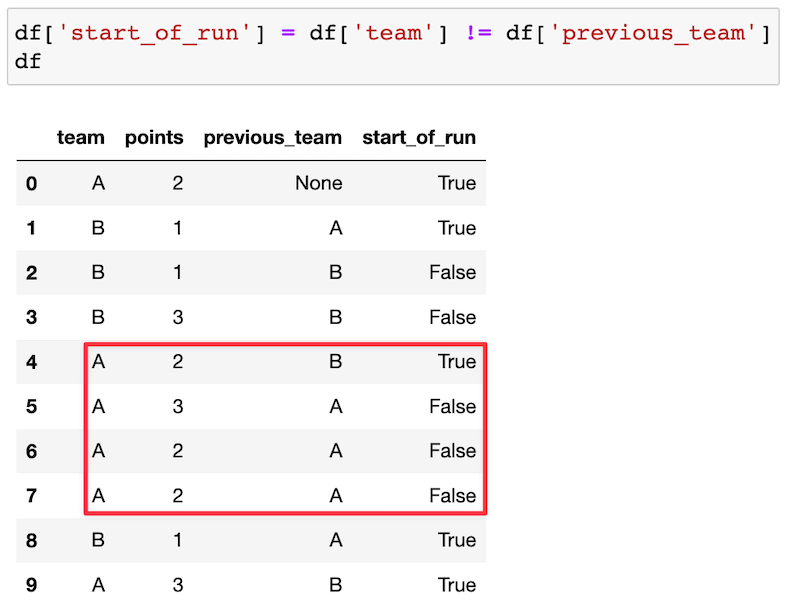
Do you see how that works?
By checking whether a given team value is equal to the value in the previous row, we now know when each scoring run starts!
Finally, we use the cumsum() method to assign a run_id to each scoring run:
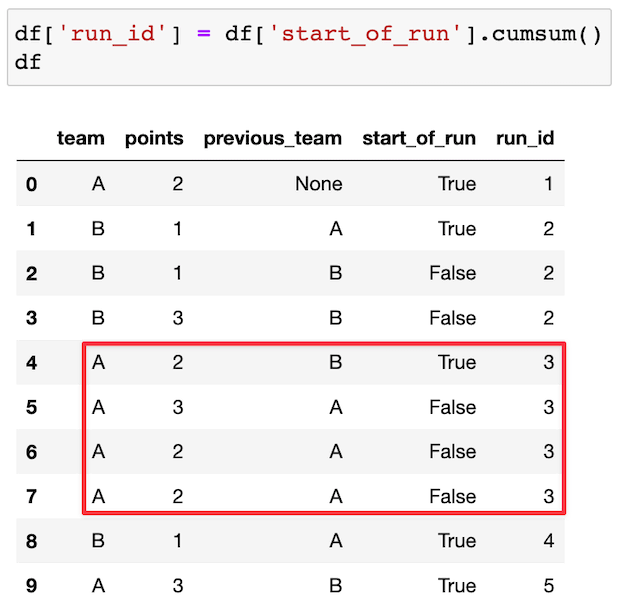
Wait, what just happened?
Any time you do math on a boolean column, True gets treated as 1 and False gets treated as 0. Thus by taking the cumulative sum of the start_of_run column, the run_id increments every time it reaches a True value. (Neat, right?)
Shout out to Josh Devlin's excellent blog post, Calculating Streaks in Pandas, for teaching me this exact approach!
List all scoring runs
Now that each run has been assigned an id, we use a groupby() to show the number of points scored by each team during each run:
That's it! Here's the code from this post, in case you want to experiment with it.
P.S. Want to get better at using pandas? Sign up for my FREE 7-hour course, pandas in 30 days!